Design mini tools, forms, charts, live boards using TablePlus
Requirements
- Download and install TablePlus, TablePlus is available for macOS, Windows, Linux, and iOS.
- Create a database connection
- Database example script using PostgreSQL syntax that will be used in this blog.
CREATE TABLE public.products (id int,name text,price int,created_at timestamp, PRIMARY KEY (id));
CREATE TABLE public.users (id int,name text,created_at timestamp, PRIMARY KEY (id));
CREATE TABLE public.orders (id int,product_id int,user_id int,created_at timestamp, PRIMARY KEY (id));

INSERT INTO public.users (id, name, created_at) VALUES
(1, 'John Doe', '2024-01-01'),(2, 'Jane Smith', '2024-01-02'),(3, 'Bob Johnson', '2024-01-03'),(4, 'Alice Williams', '2024-02-01'),(5, 'Charlie Brown', '2024-02-02'),(6, 'David Miller', '2024-02-03'),(7, 'Eva Davis', '2024-02-04'),(8, 'Frank Wilson', '2024-02-05'),(9, 'Grace Taylor', '2024-02-06'),(10, 'Henry Harris', '2024-03-01'),(11, 'Ivy Martinez', '2024-03-02'),(12, 'Jack Robinson', '2024-03-03'),(13, 'Kelly White', '2024-03-04'),(14, 'Leo Thomas', '2024-03-05'),(15, 'Mia Lee', '2024-03-06'),(16, 'Nathan Hall', '2024-03-07'),(17, 'Olivia Moore', '2024-03-08');

INSERT INTO public.products (id, name, price, created_at) VALUES
  (1, 'Apple', 2, '2024-01-01'),(2, 'Orange', 3, '2024-01-02'),(3, 'Banana', 1, '2024-01-03'),(4, 'Grapes', 5, '2024-01-04'),(5, 'Mango', 4, '2024-01-05'),(6, 'Pineapple', 6, '2024-02-01'),(7, 'Strawberry', 3, '2024-02-02'),(8, 'Kiwi', 4, '2024-02-03'),(9, 'Peach', 5, '2024-03-01'),(10, 'Plum', 2, '2024-03-02'),(11, 'Watermelon', 7, '2024-03-03'),(12, 'Cherry', 3, '2024-03-04'),(13, 'Pomegranate', 6, '2024-03-05'),(14, 'Blueberry', 4, '2024-03-06'),(15, 'Raspberry', 3, '2024-03-07'),(16, 'Cantaloupe', 8, '2024-03-08');

INSERT INTO public.orders (id, product_id, user_id, created_at) VALUES
  (1, 1, 1, '2024-01-10'),(2, 2, 2, '2024-01-12'),(3, 3, 3, '2024-01-15'),(4, 4, 4, '2024-01-18'),(5, 5, 5, '2024-01-20'),(6, 6, 6, '2024-01-25'),(7, 7, 7, '2024-02-05'),(8, 8, 8, '2024-02-10'),(9, 9, 9, '2024-02-15'),(10, 10, 10, '2024-02-18'),(11, 11, 11, '2024-02-20'),(12, 12, 12, '2024-02-25'),(13, 13, 13, '2024-02-28'),(14, 14, 14, '2024-02-28'),(15, 15, 15, '2024-02-28'),(16, 16, 16, '2024-02-28'),(17, 1, 1, '2024-03-05'),(18, 2, 2, '2024-03-10'),(19, 3, 3, '2024-03-15'),(20, 4, 4, '2024-03-18'),(21, 5, 5, '2024-03-20'),(22, 6, 6, '2024-03-25'),(23, 7, 7, '2024-03-28'),(24, 8, 8, '2024-03-28'),(25, 9, 9, '2024-03-28'),(26, 10, 10, '2024-03-28'),(27, 11, 11, '2024-03-28'),(28, 12, 12, '2024-03-28'),(29, 13, 13, '2024-03-28'),(30, 14, 14, '2024-03-28'),(31, 15, 15, '2024-03-28'),(32, 16, 16, '2024-03-28');
In this tututorial we will learn how to design mini tools using TablePlus
1. Create a live report with various types of charts.
- Open TablePlus and establish a database connection. Click the metrics board icon on the toolbar to open the board designer.


-
Click the button “add Widget” and add a bar chart (or you can right-mouse click Add > bar chart).
-
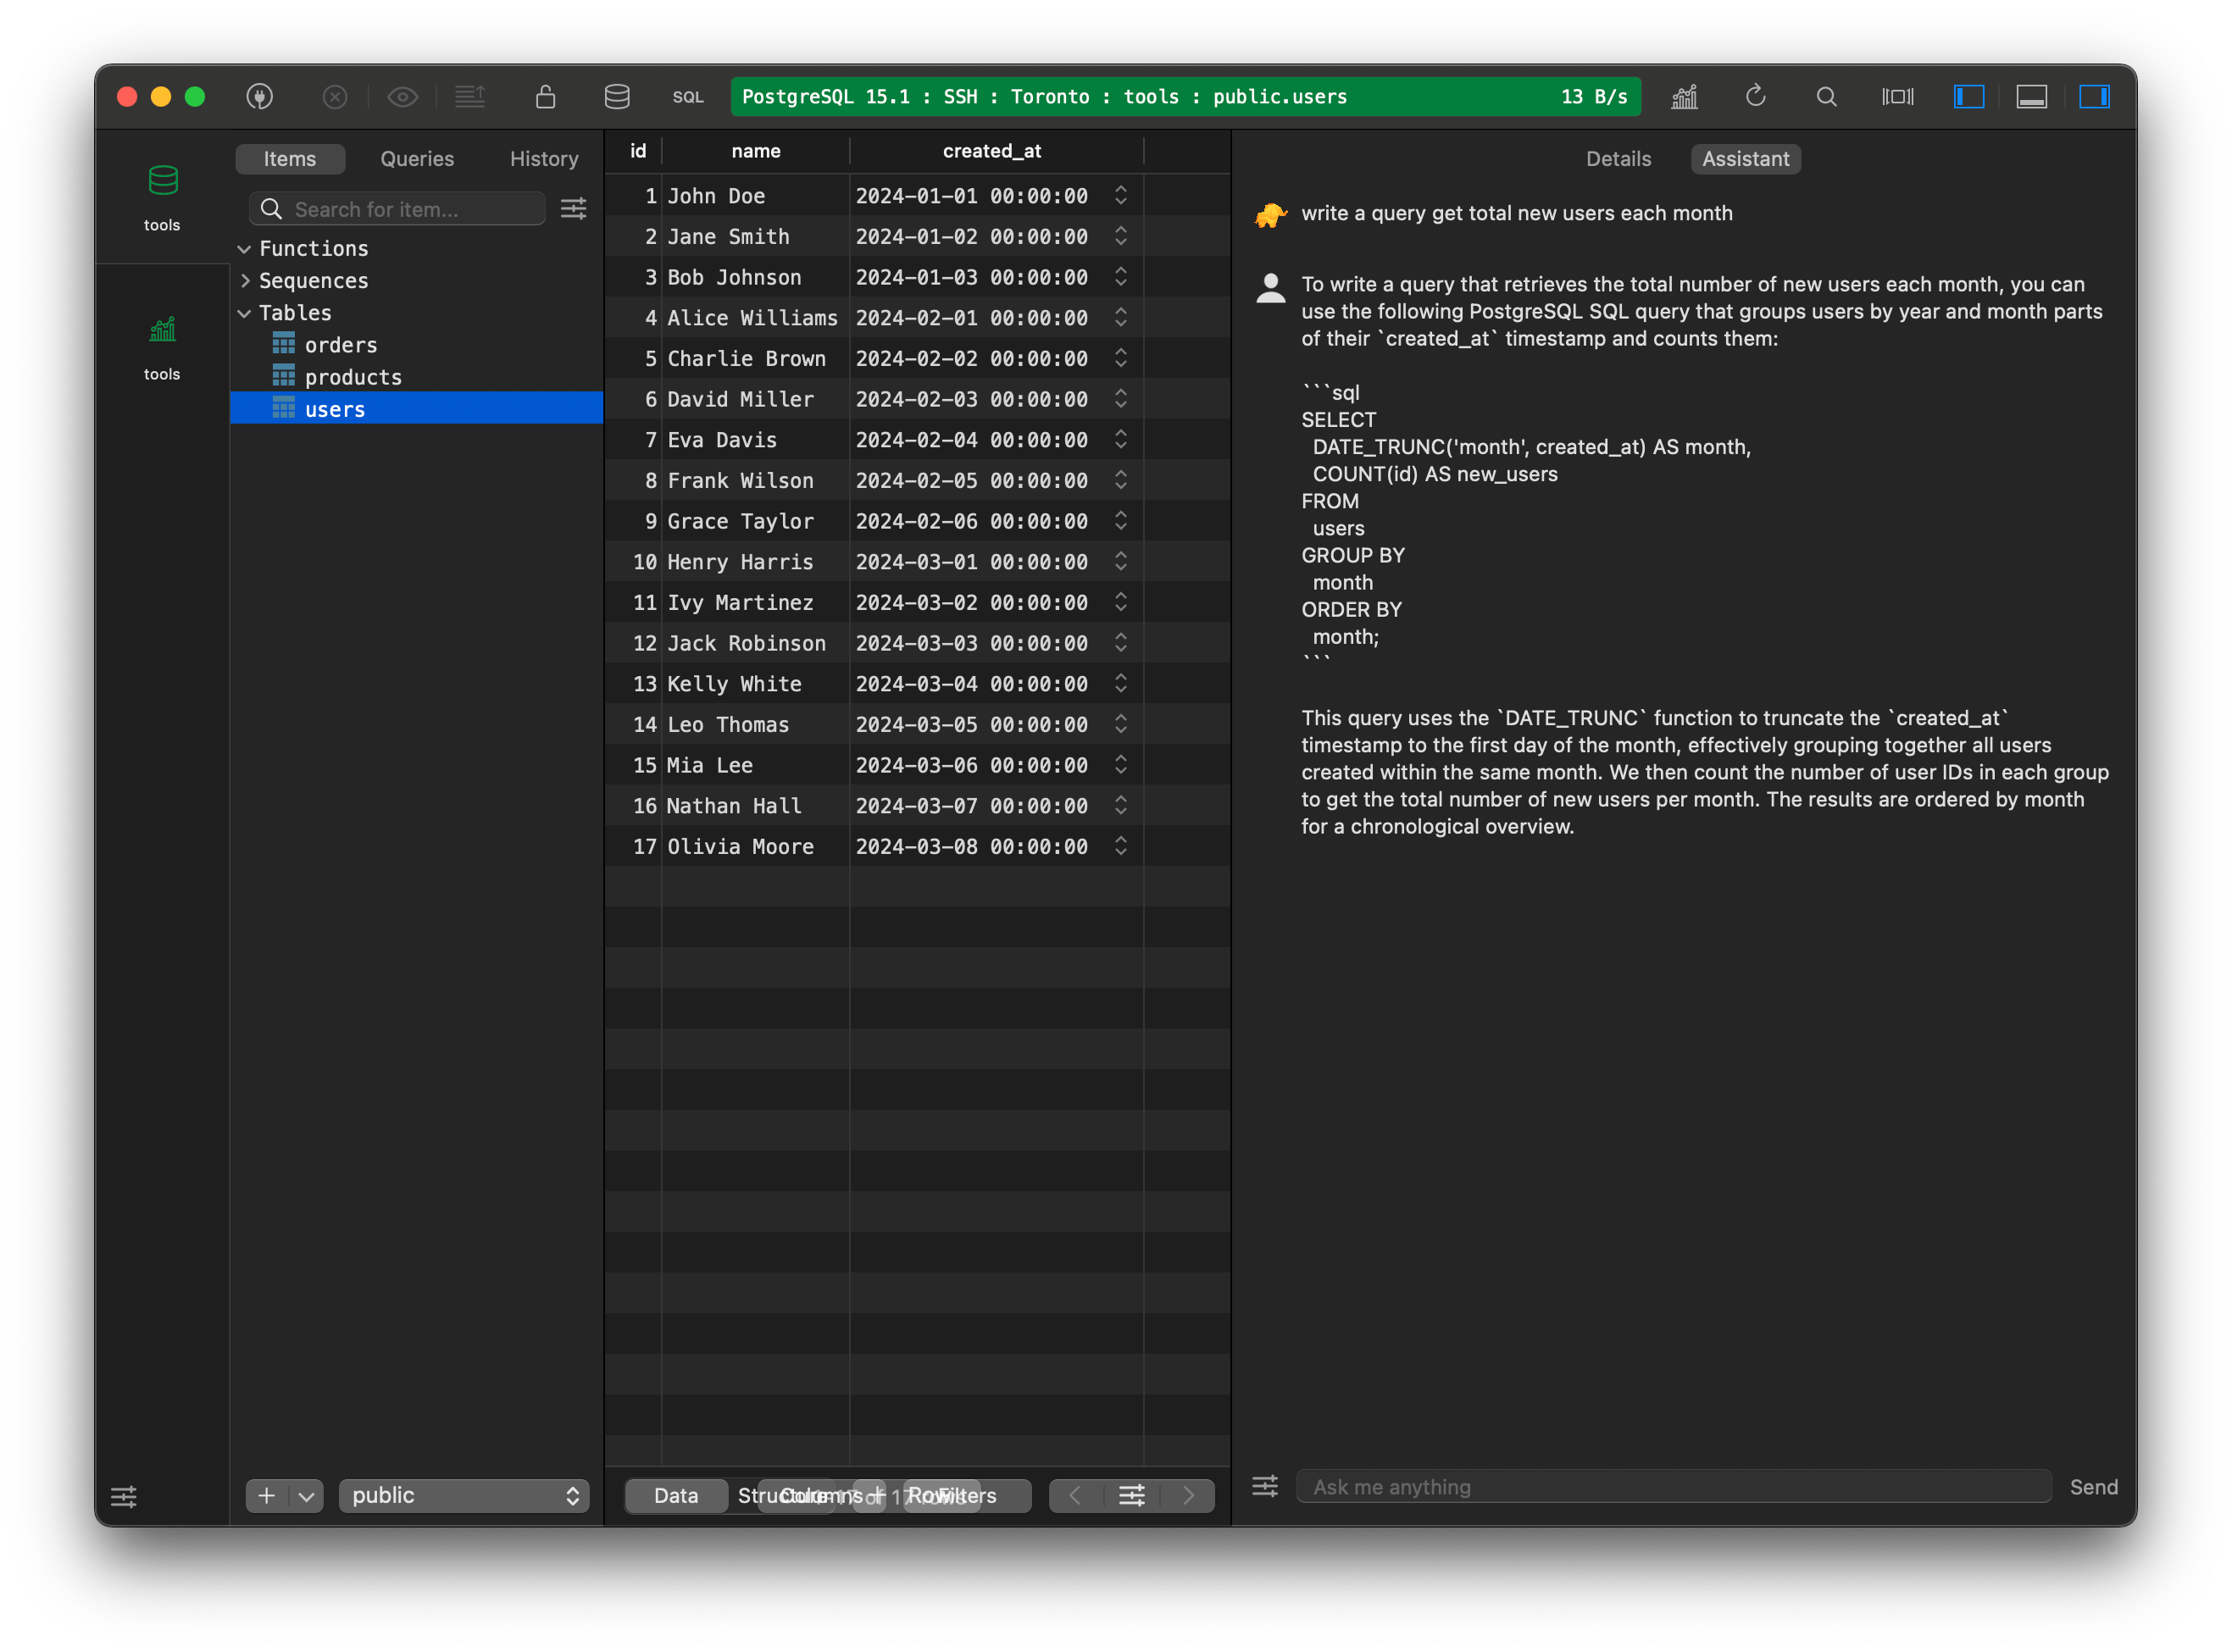
You can ask TablePlus AI assistant to write a query to get the total number of new users, group by month, and then configure it like this.
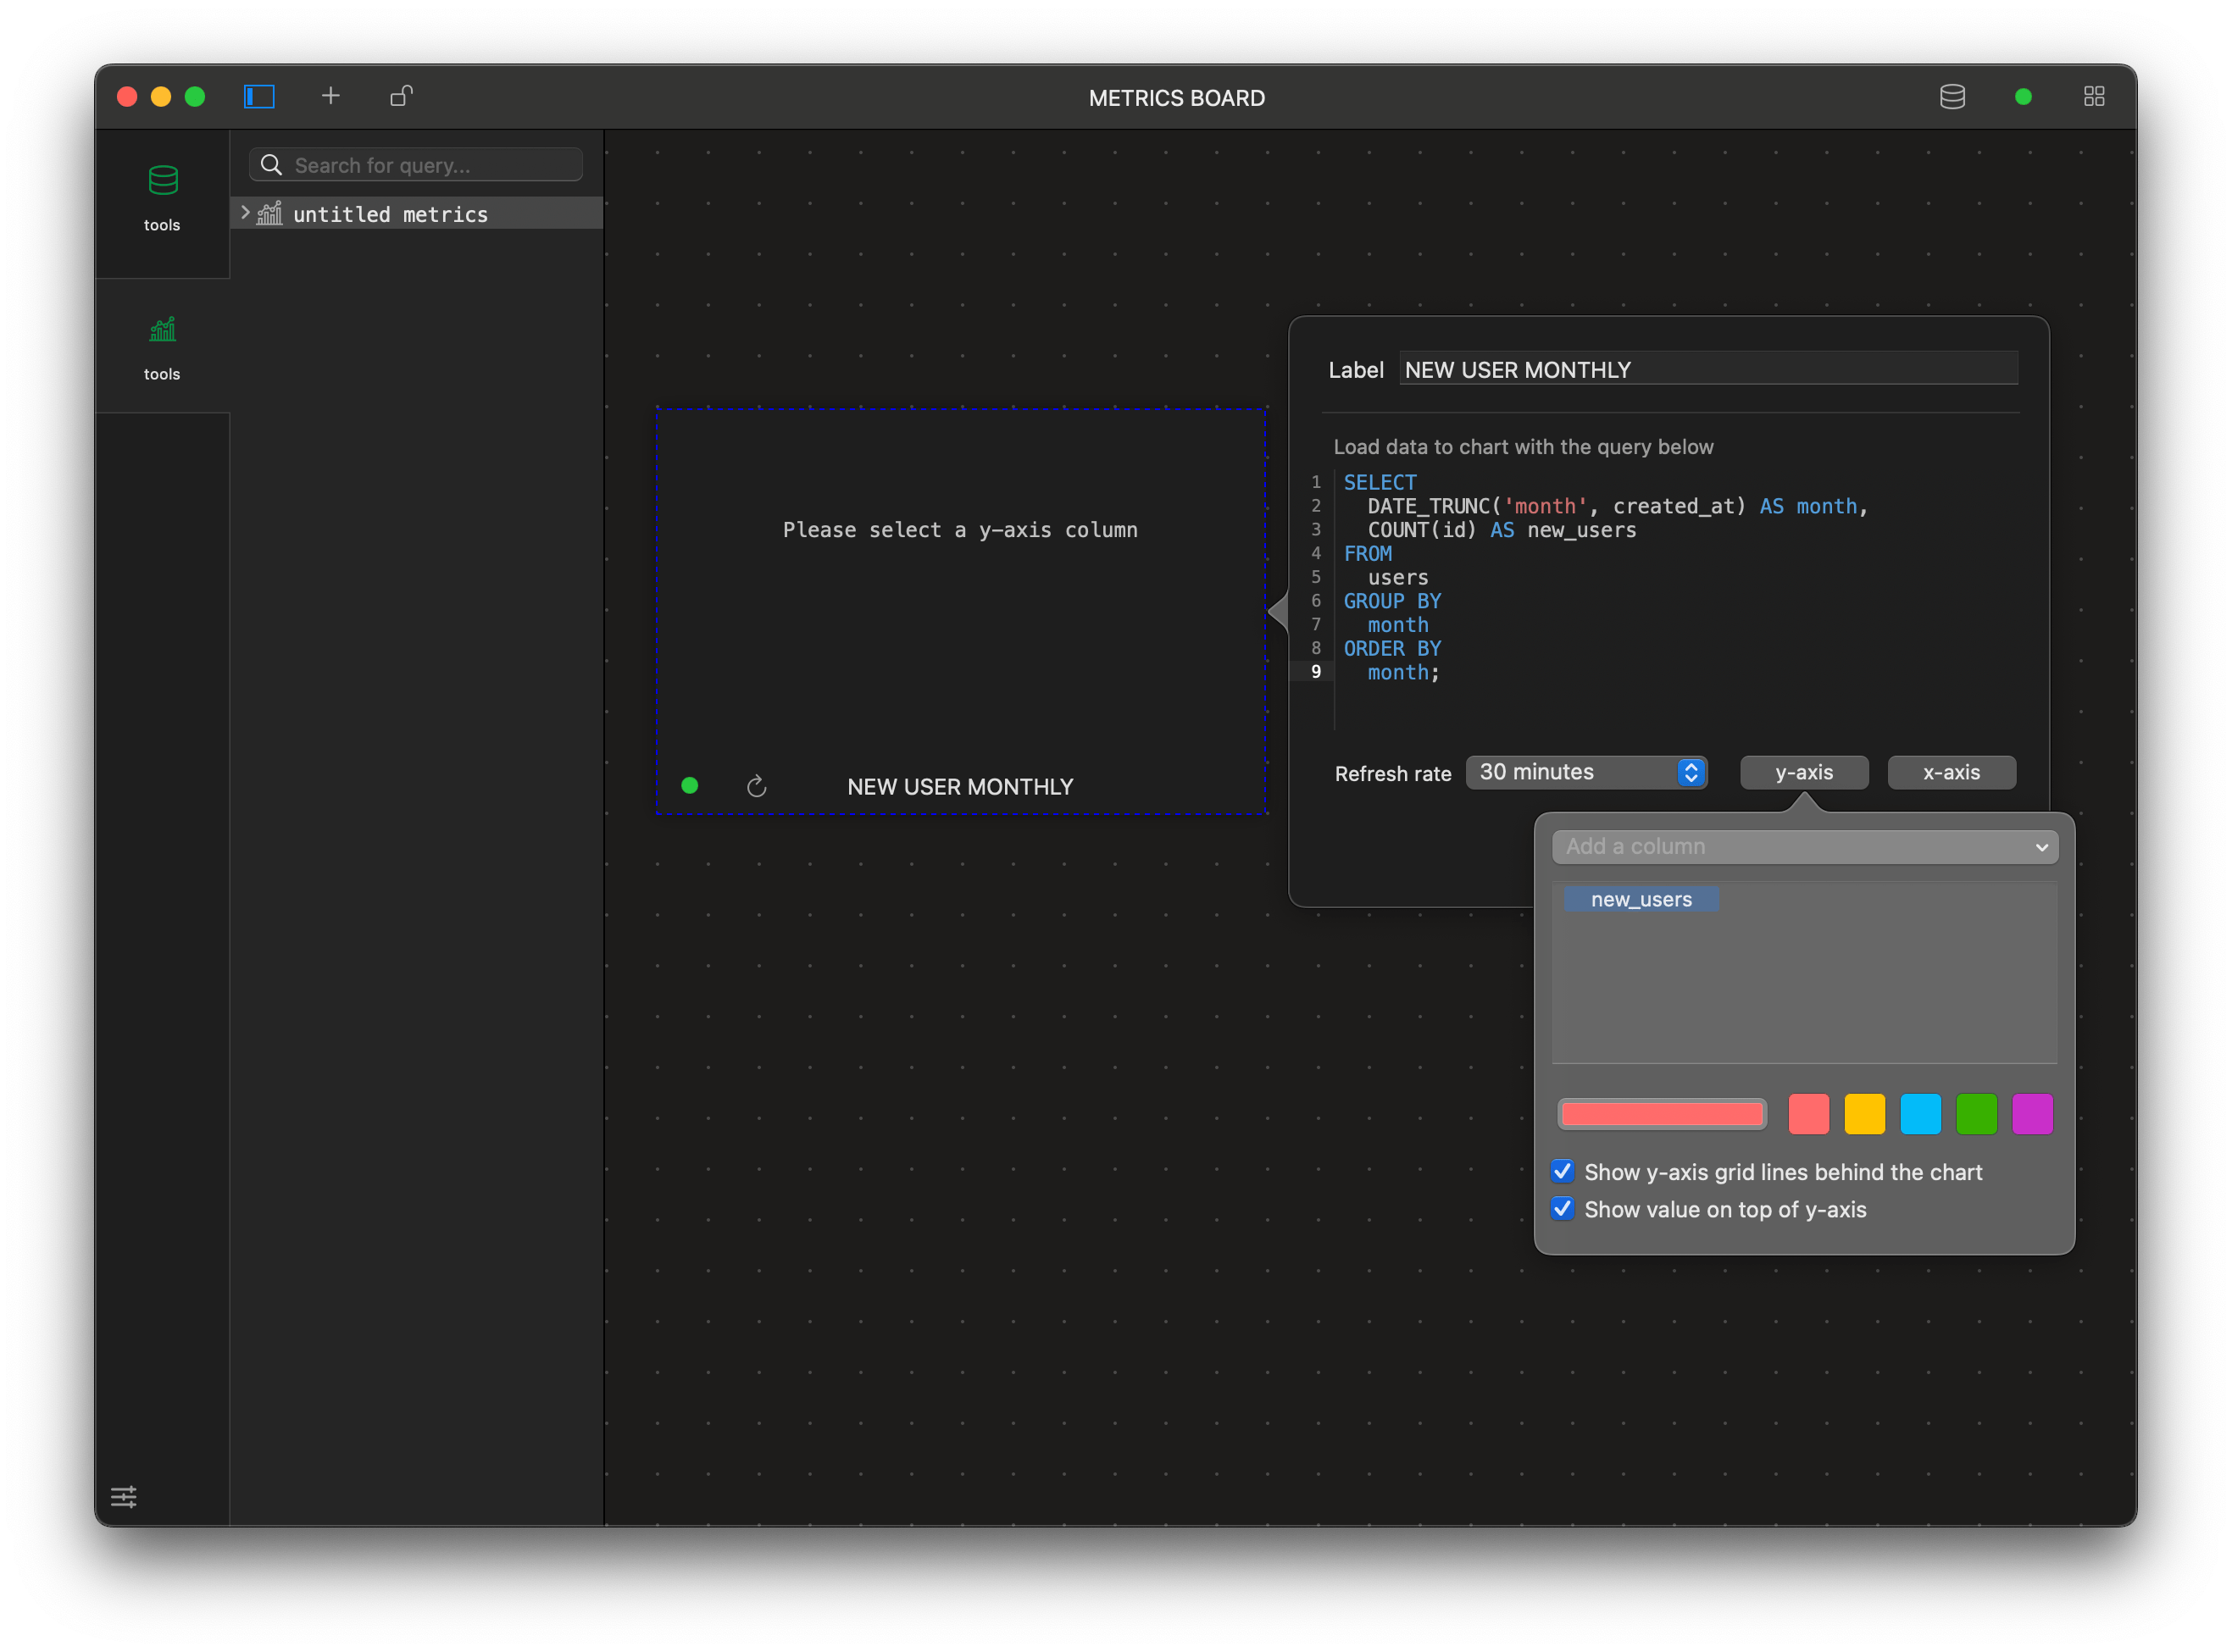
- Let’s optimize the query for a better format by changing the DATE_TRUNC to the TO_CHAR function and turning off the chart grid for a cleaner look.
SELECT
  TO_CHAR(created_at, 'YYYY-MM') AS month,
  COUNT(id) AS new_users
FROM
  users
GROUP BY
  month
ORDER BY
  month;
the final result.
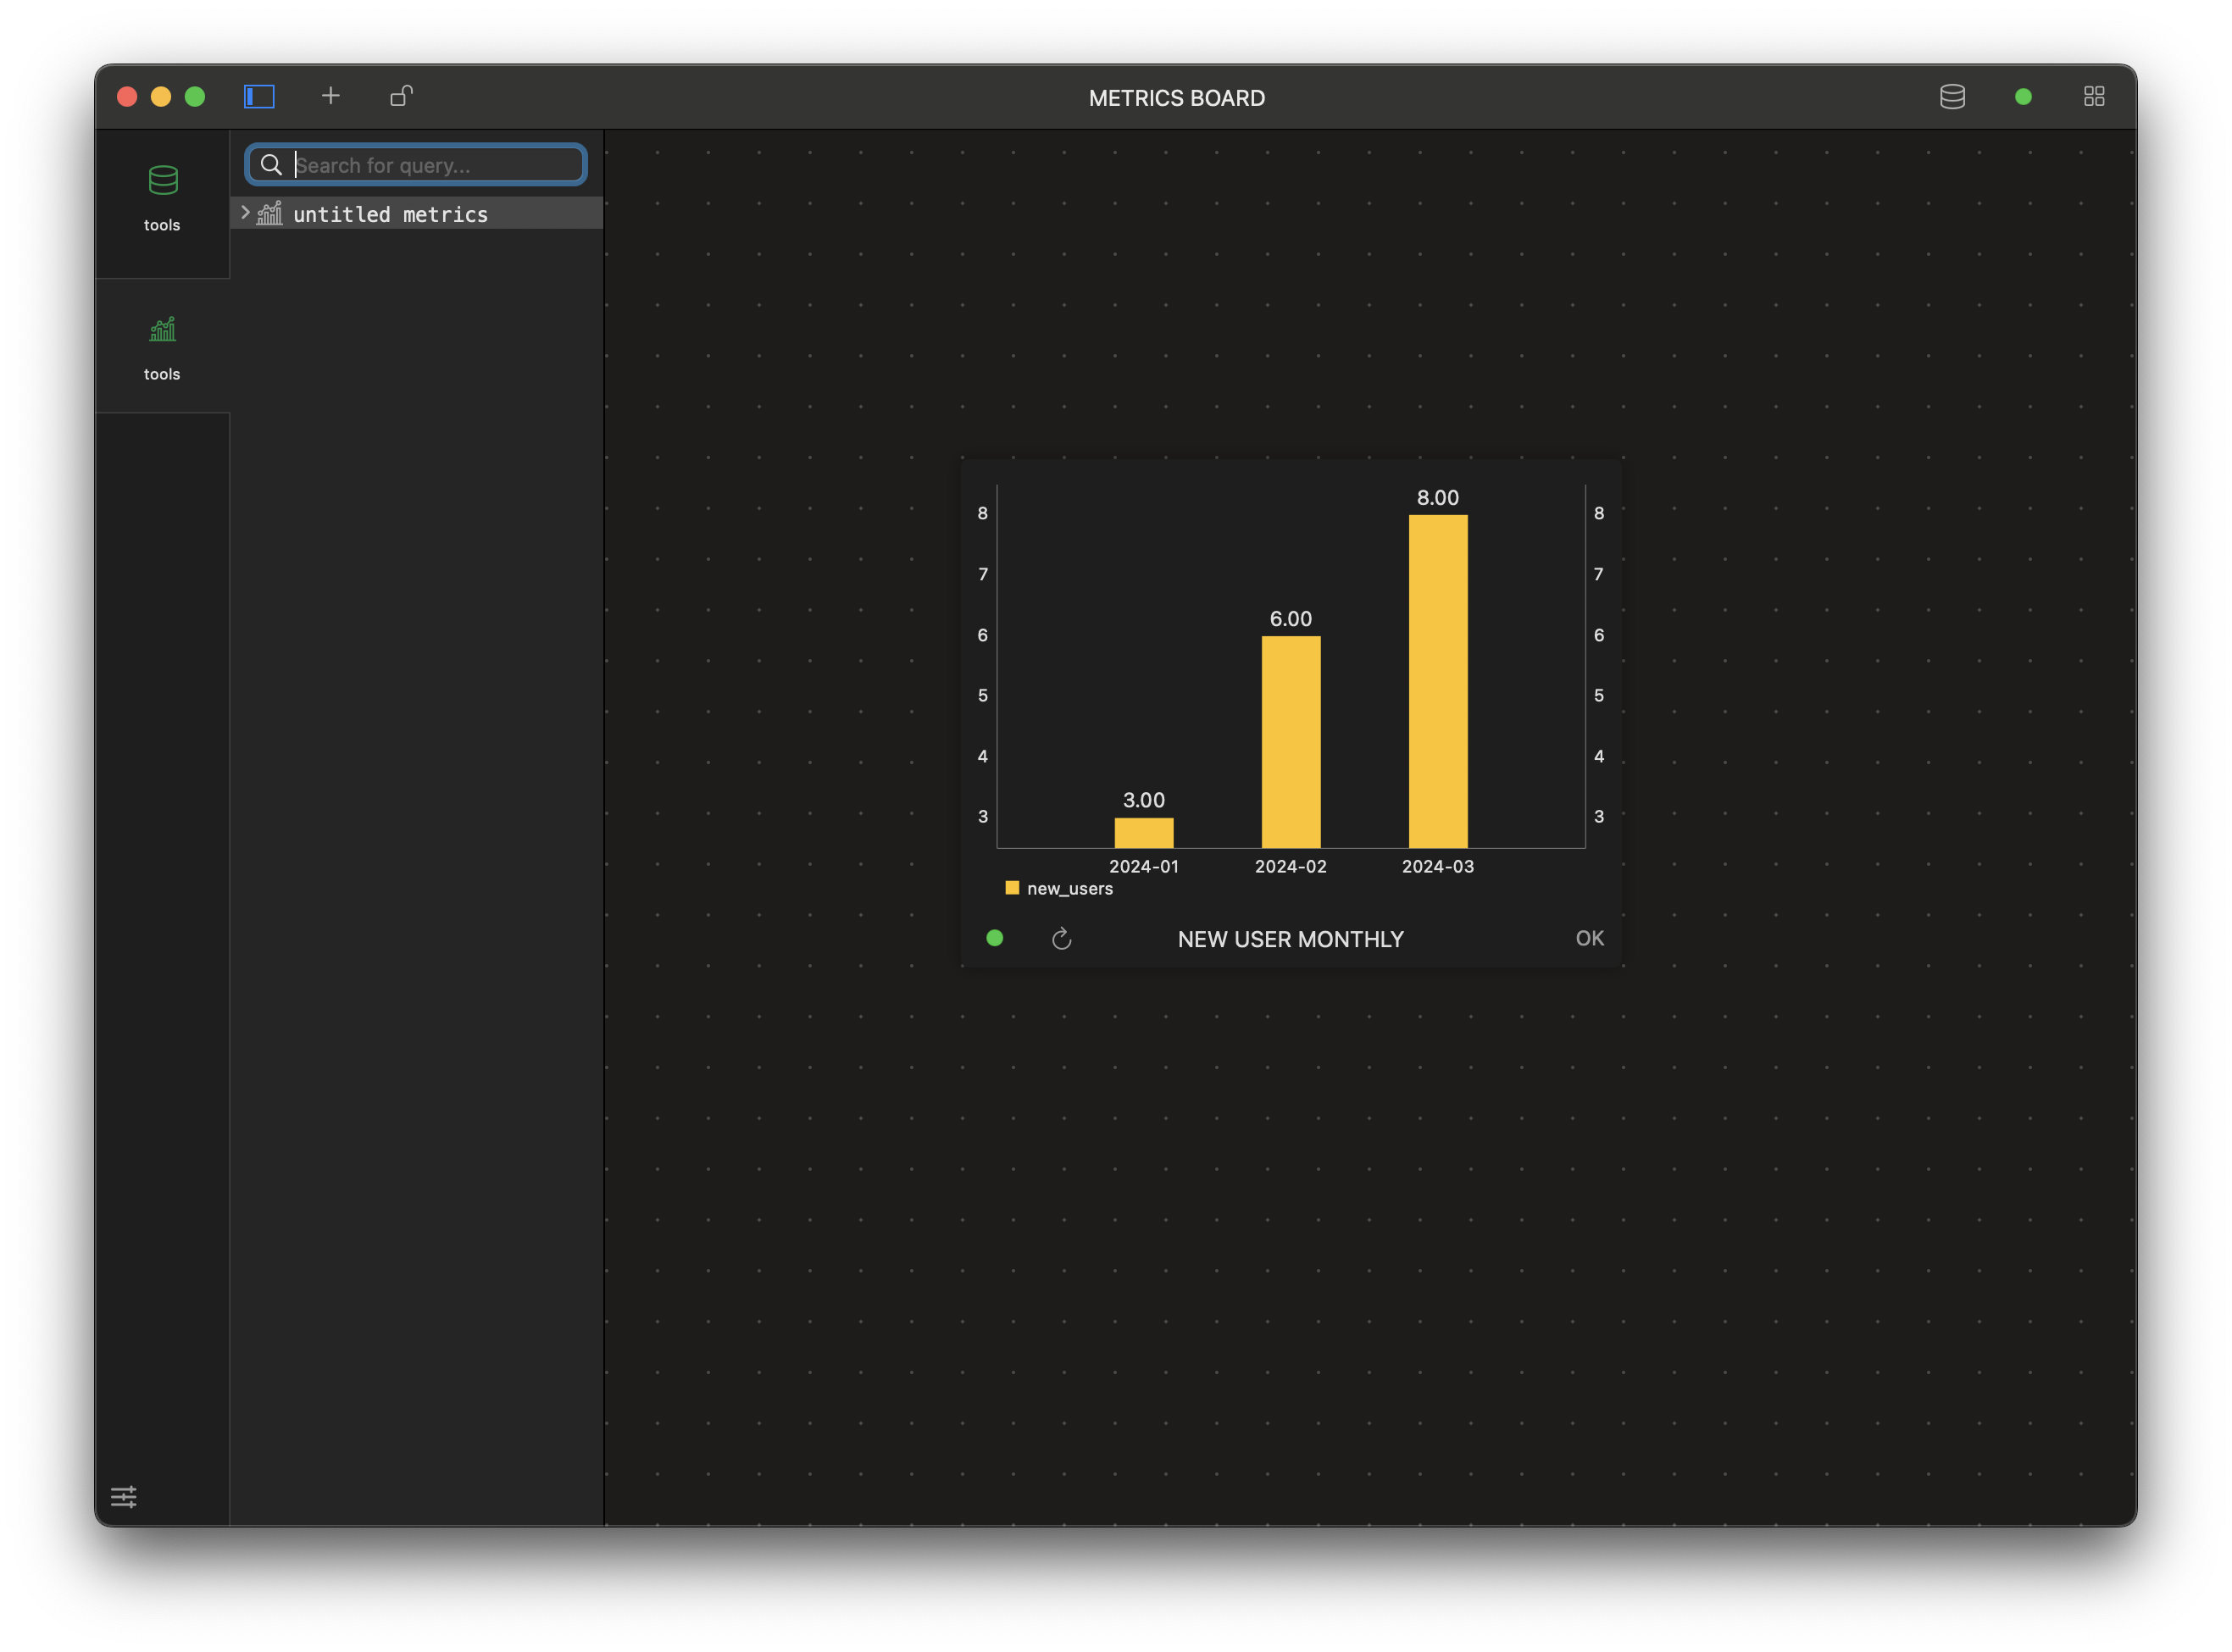
You can add more charts to the board with similar configurations; TablePlus supports line charts, bar charts, pie charts, and scoreboards.
2. Create a data form.
-
Let’s create a form where we can search for user data using some simple input field. Right-mouse click on the sidebar > New… to create a new board and name it “search for users”
-
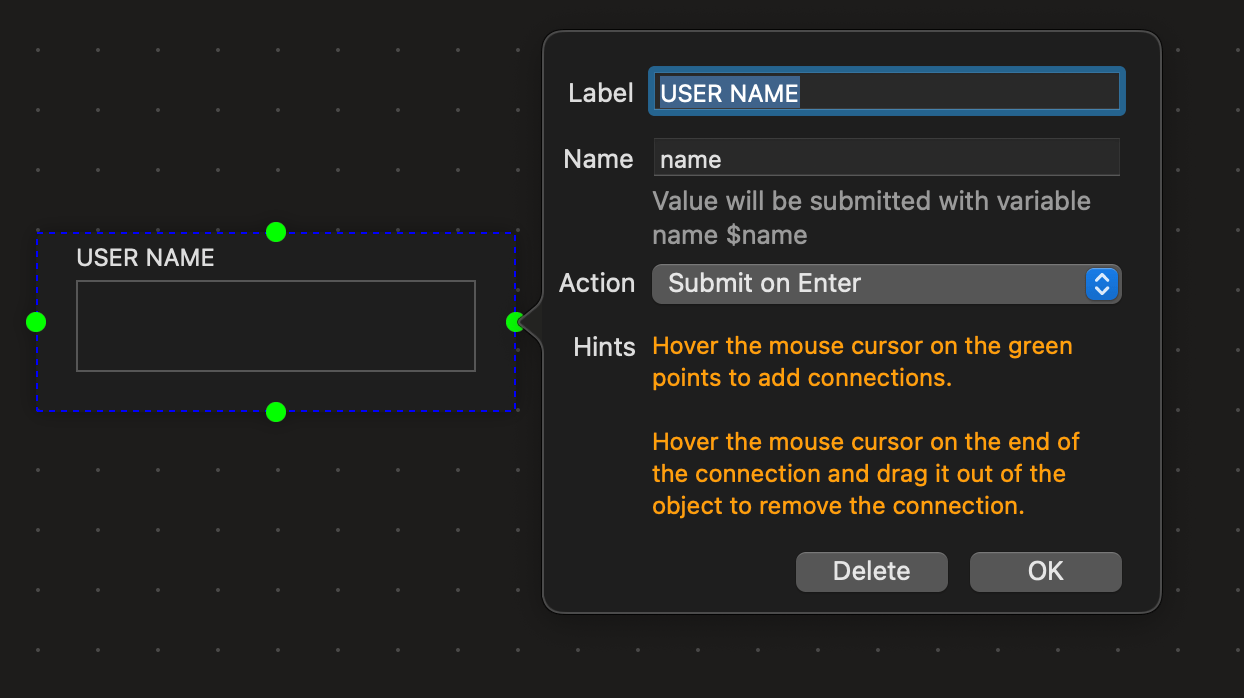
Click the button “add Widget” and add an input (or you can right-mouse click Add > input field), and then configure it like this (change label and the name entries).
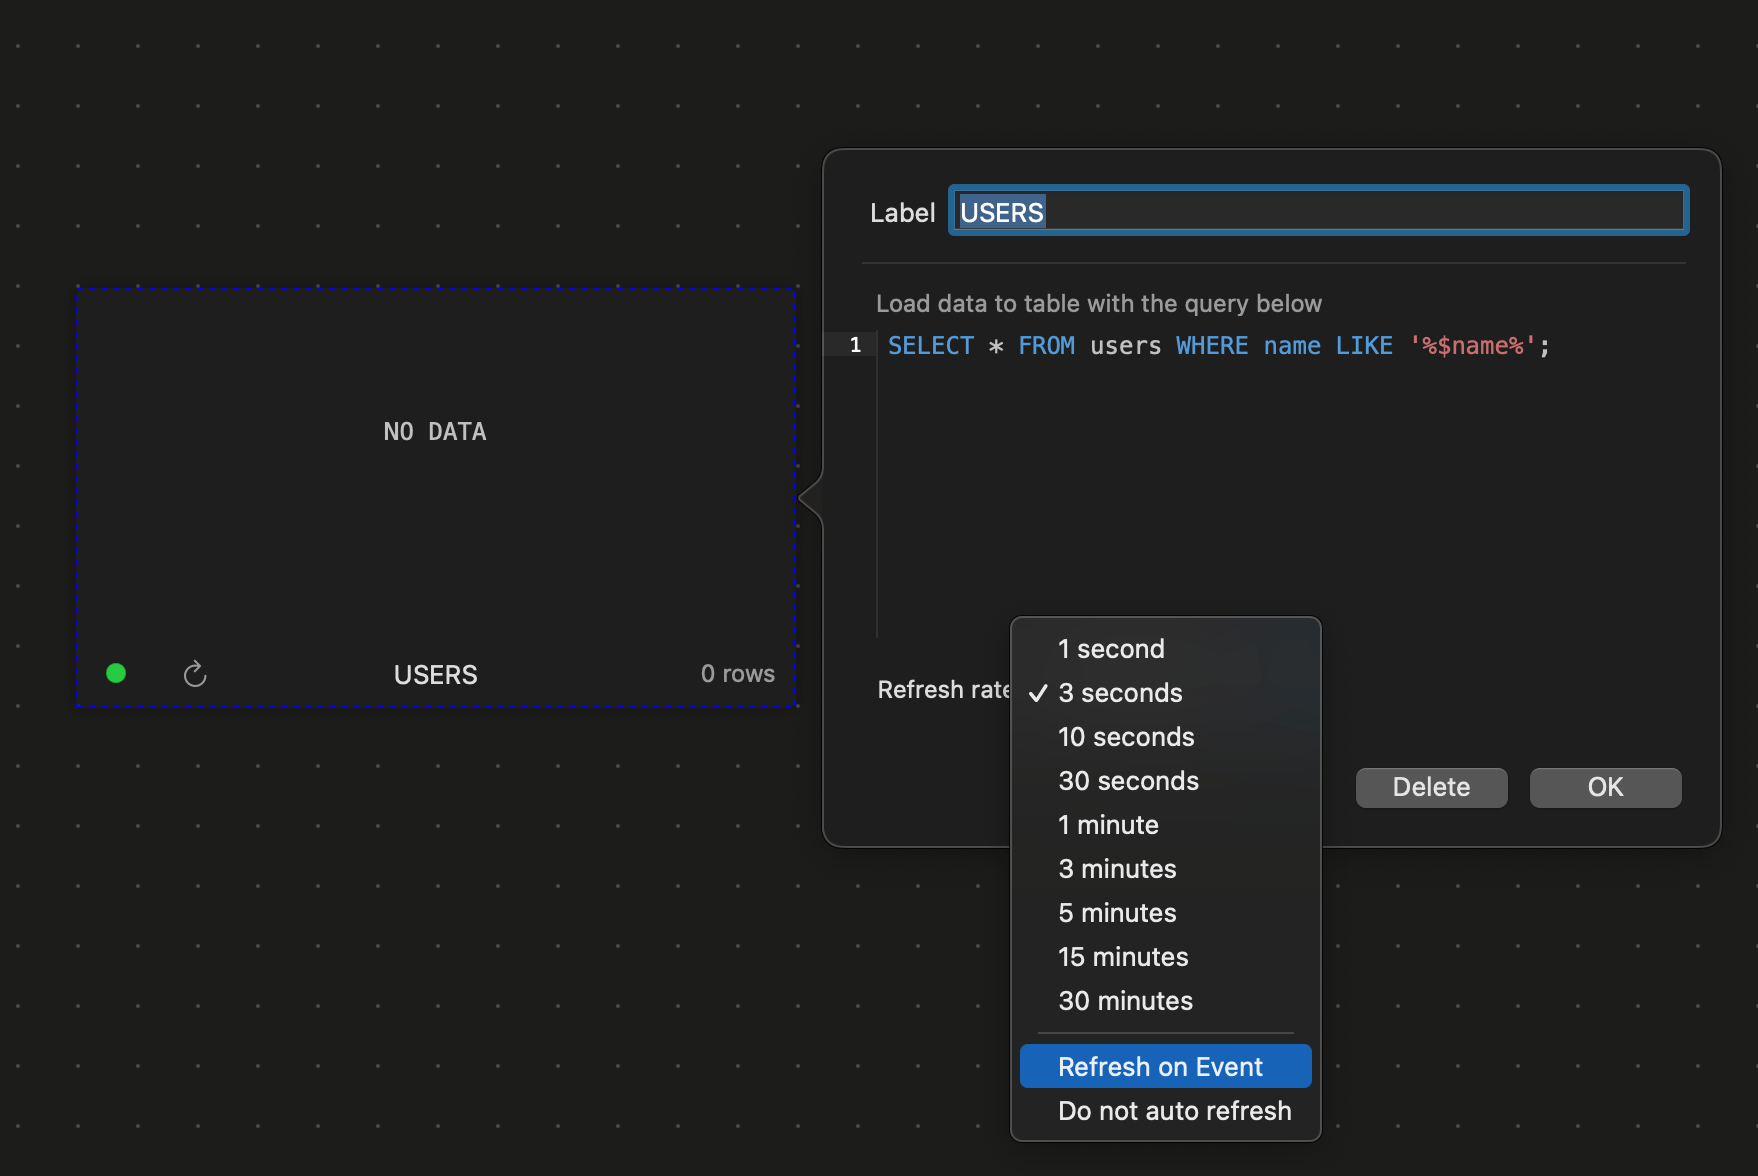
- Click the button “add Widget” add a table and then configure it like this, don’t forget to change the refresh rate to “Refresh on event”
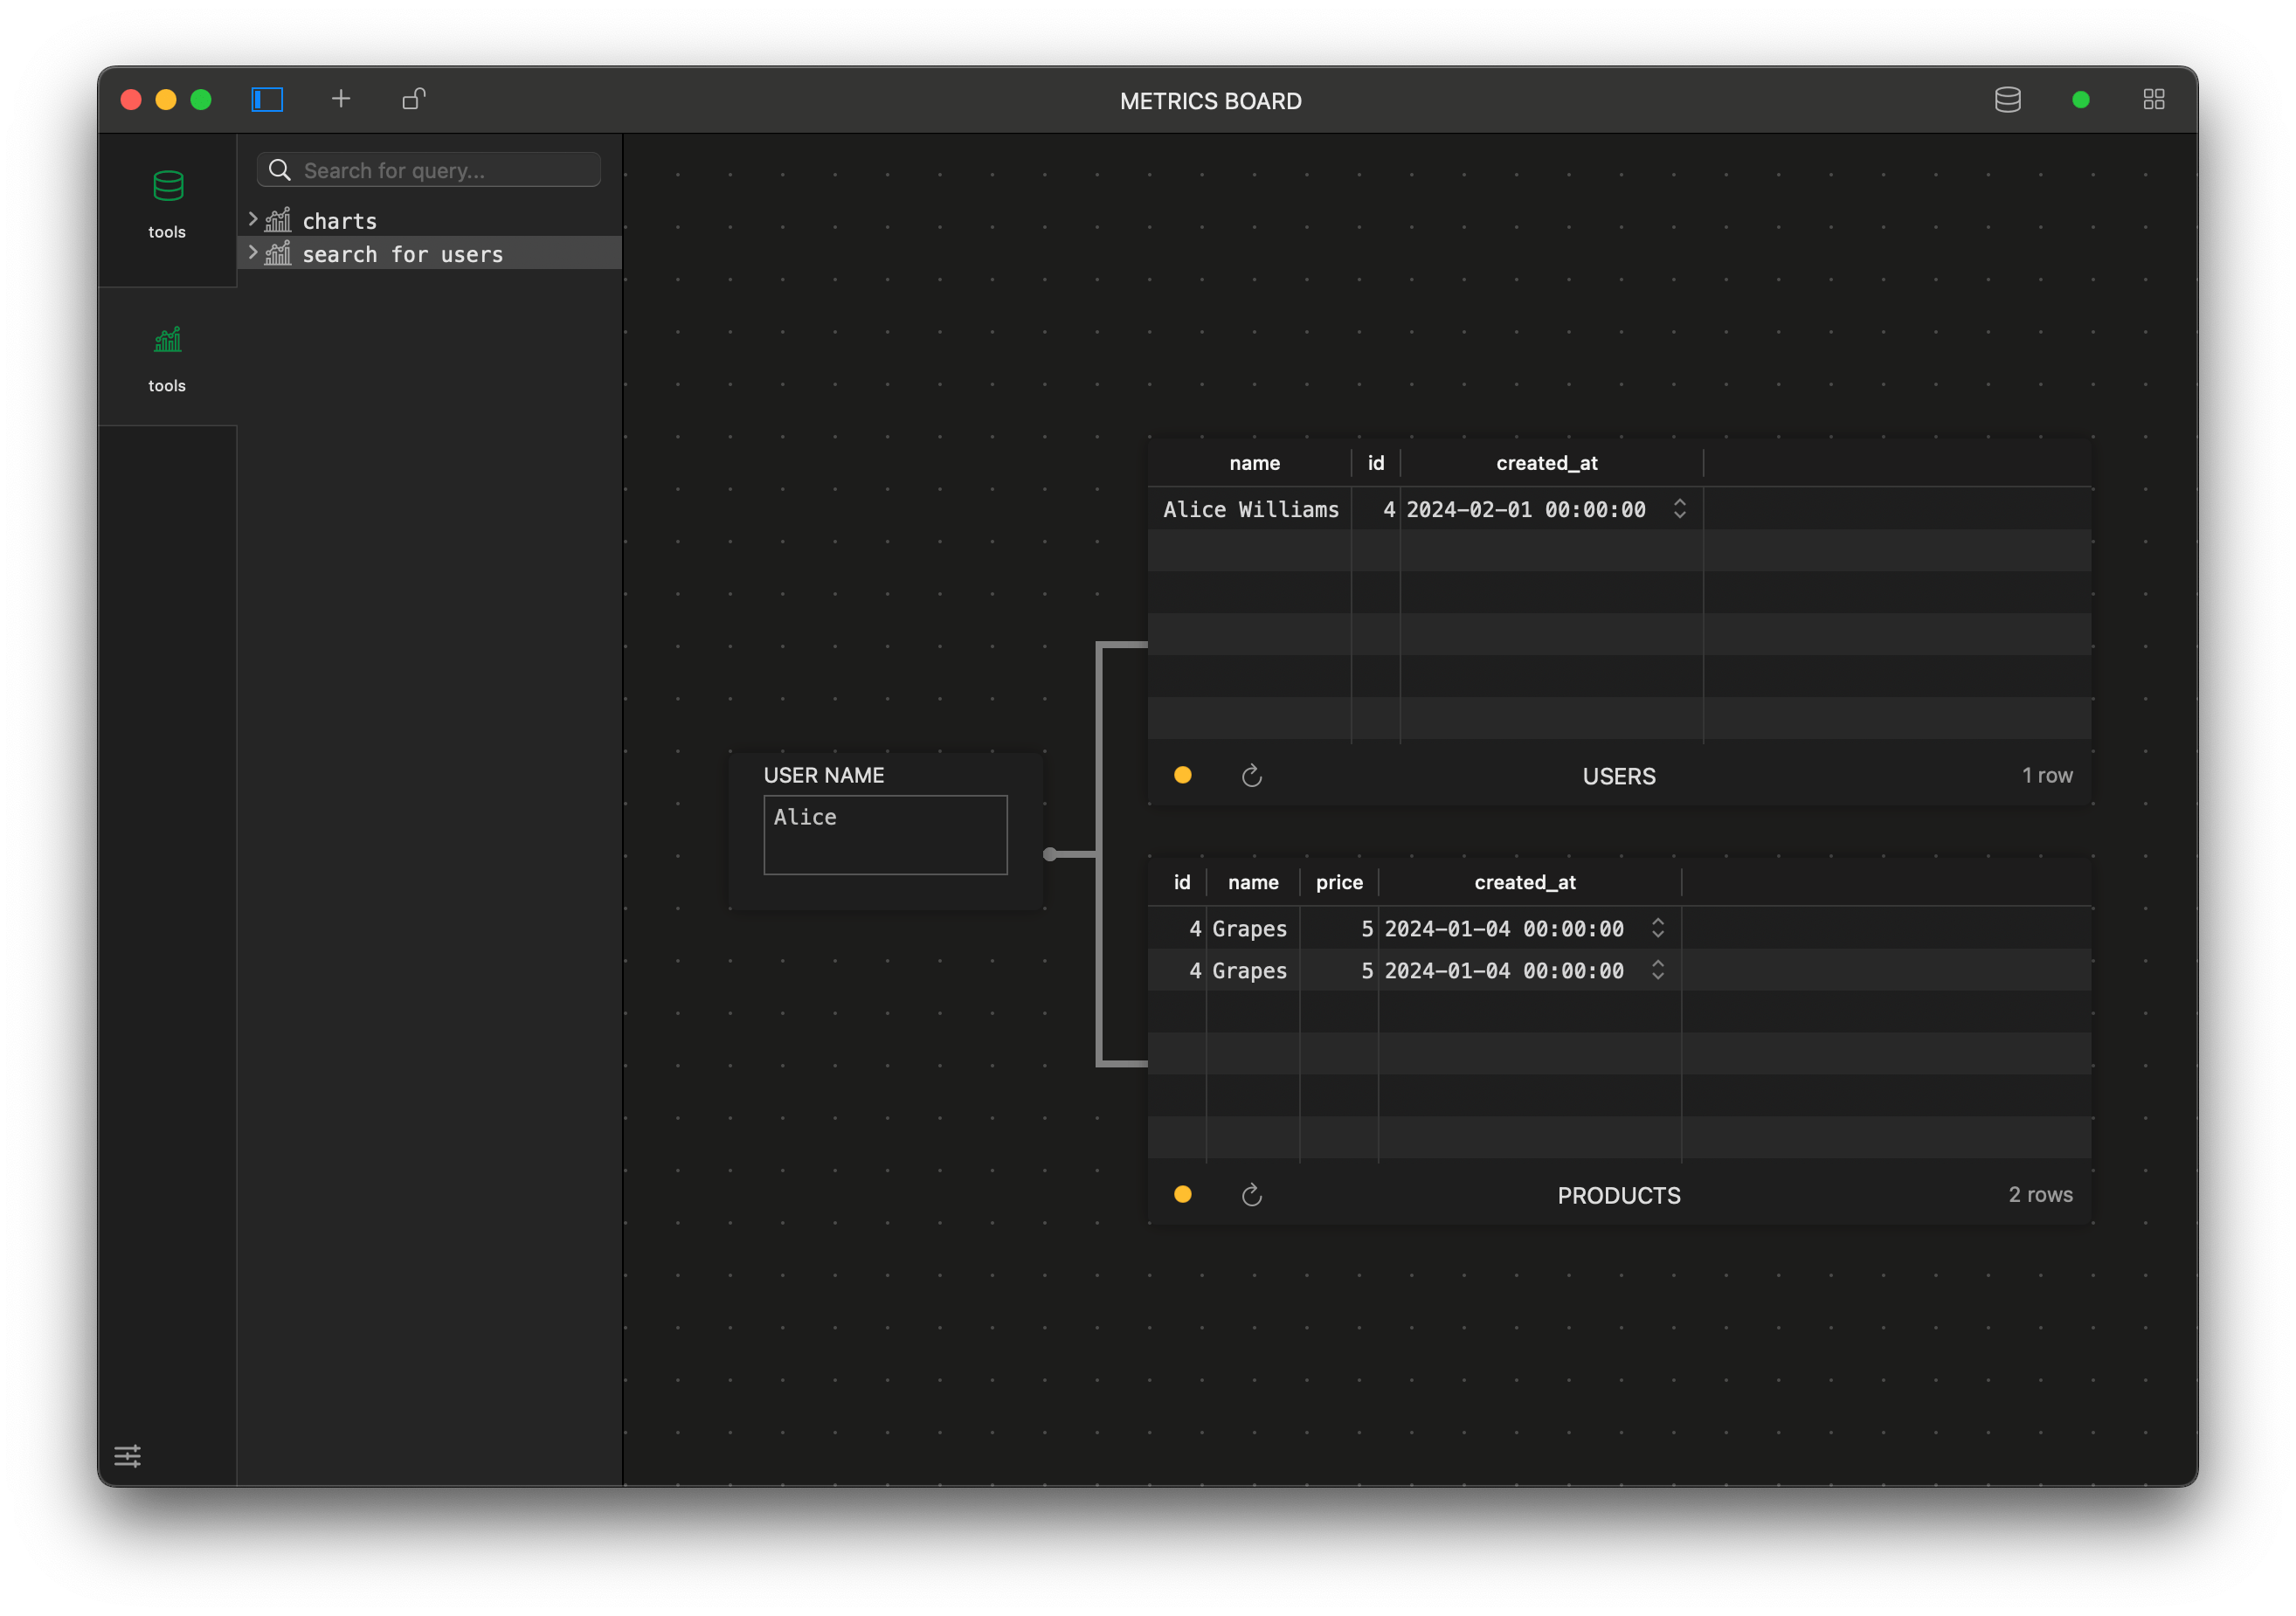
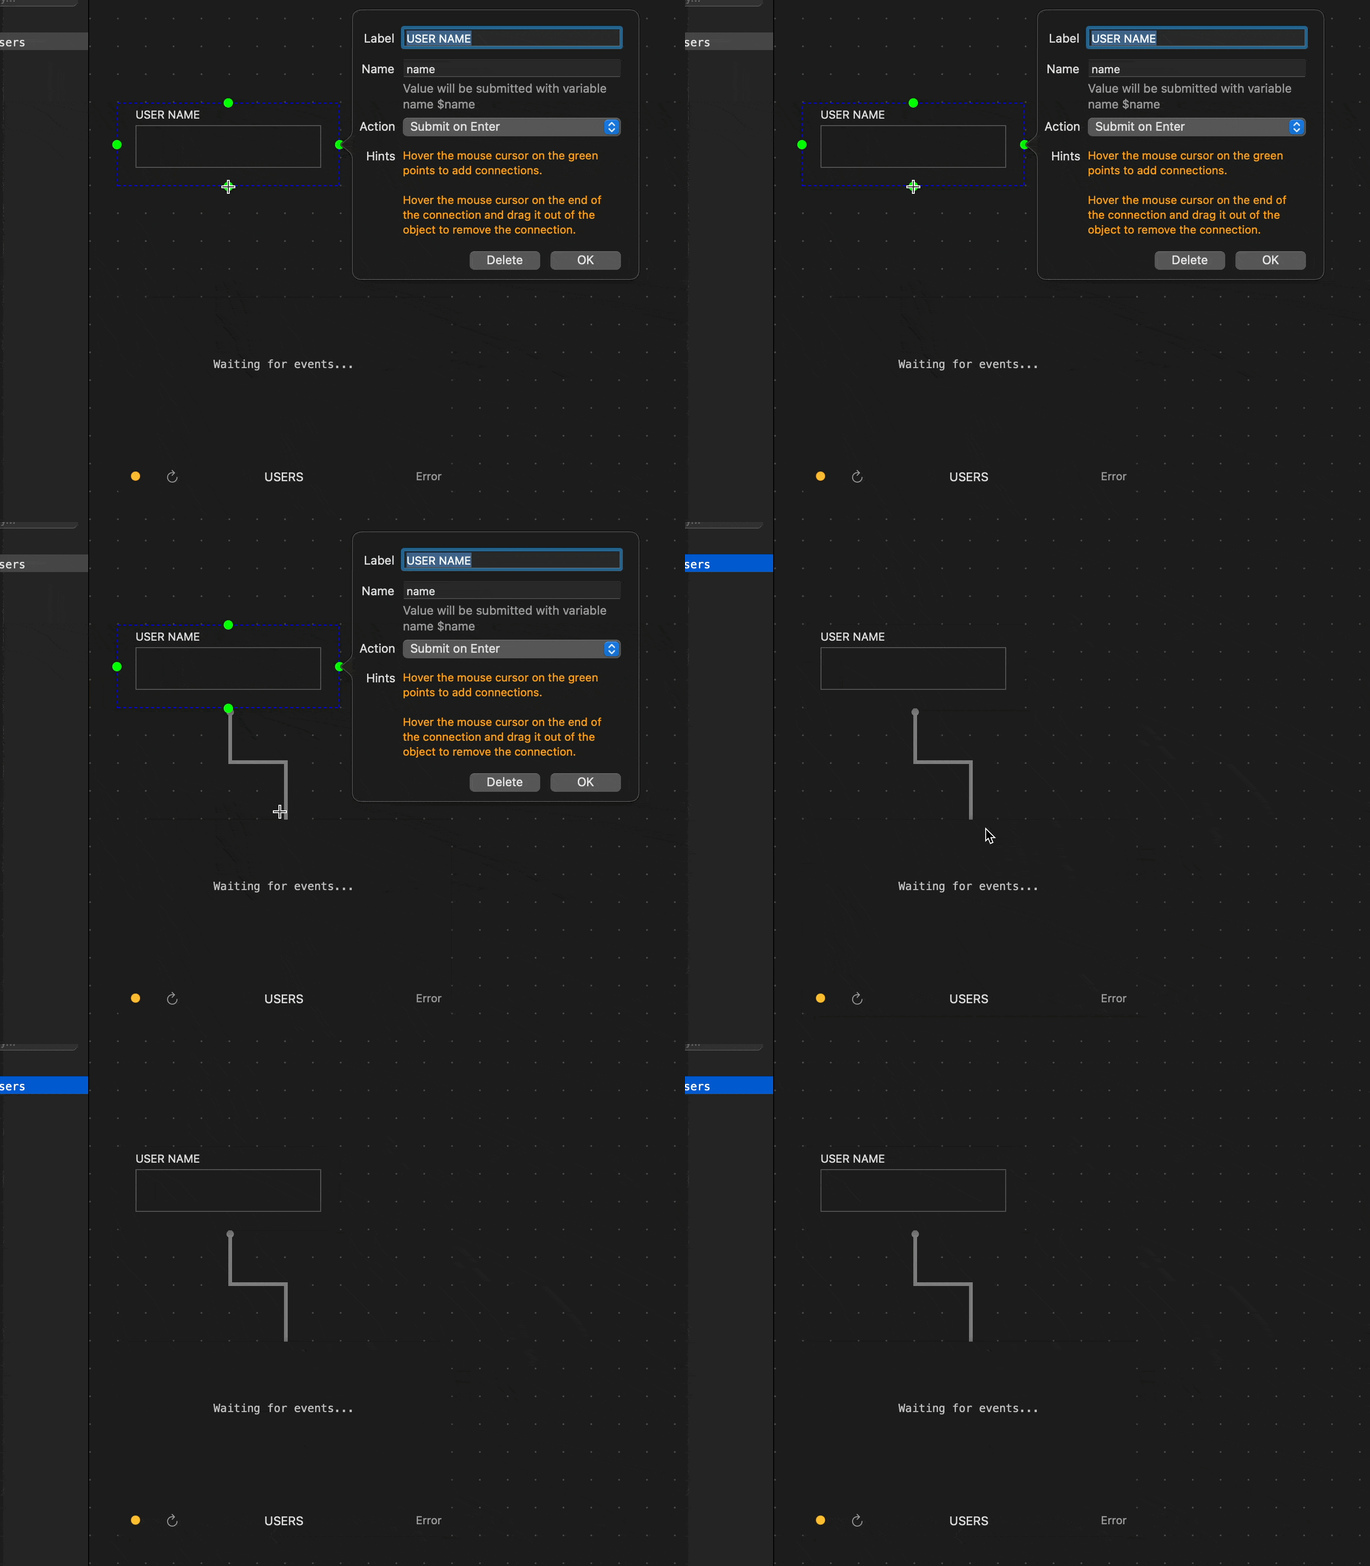
- Connect two widget above by click on the input, click on the green dot and drag it to the table.
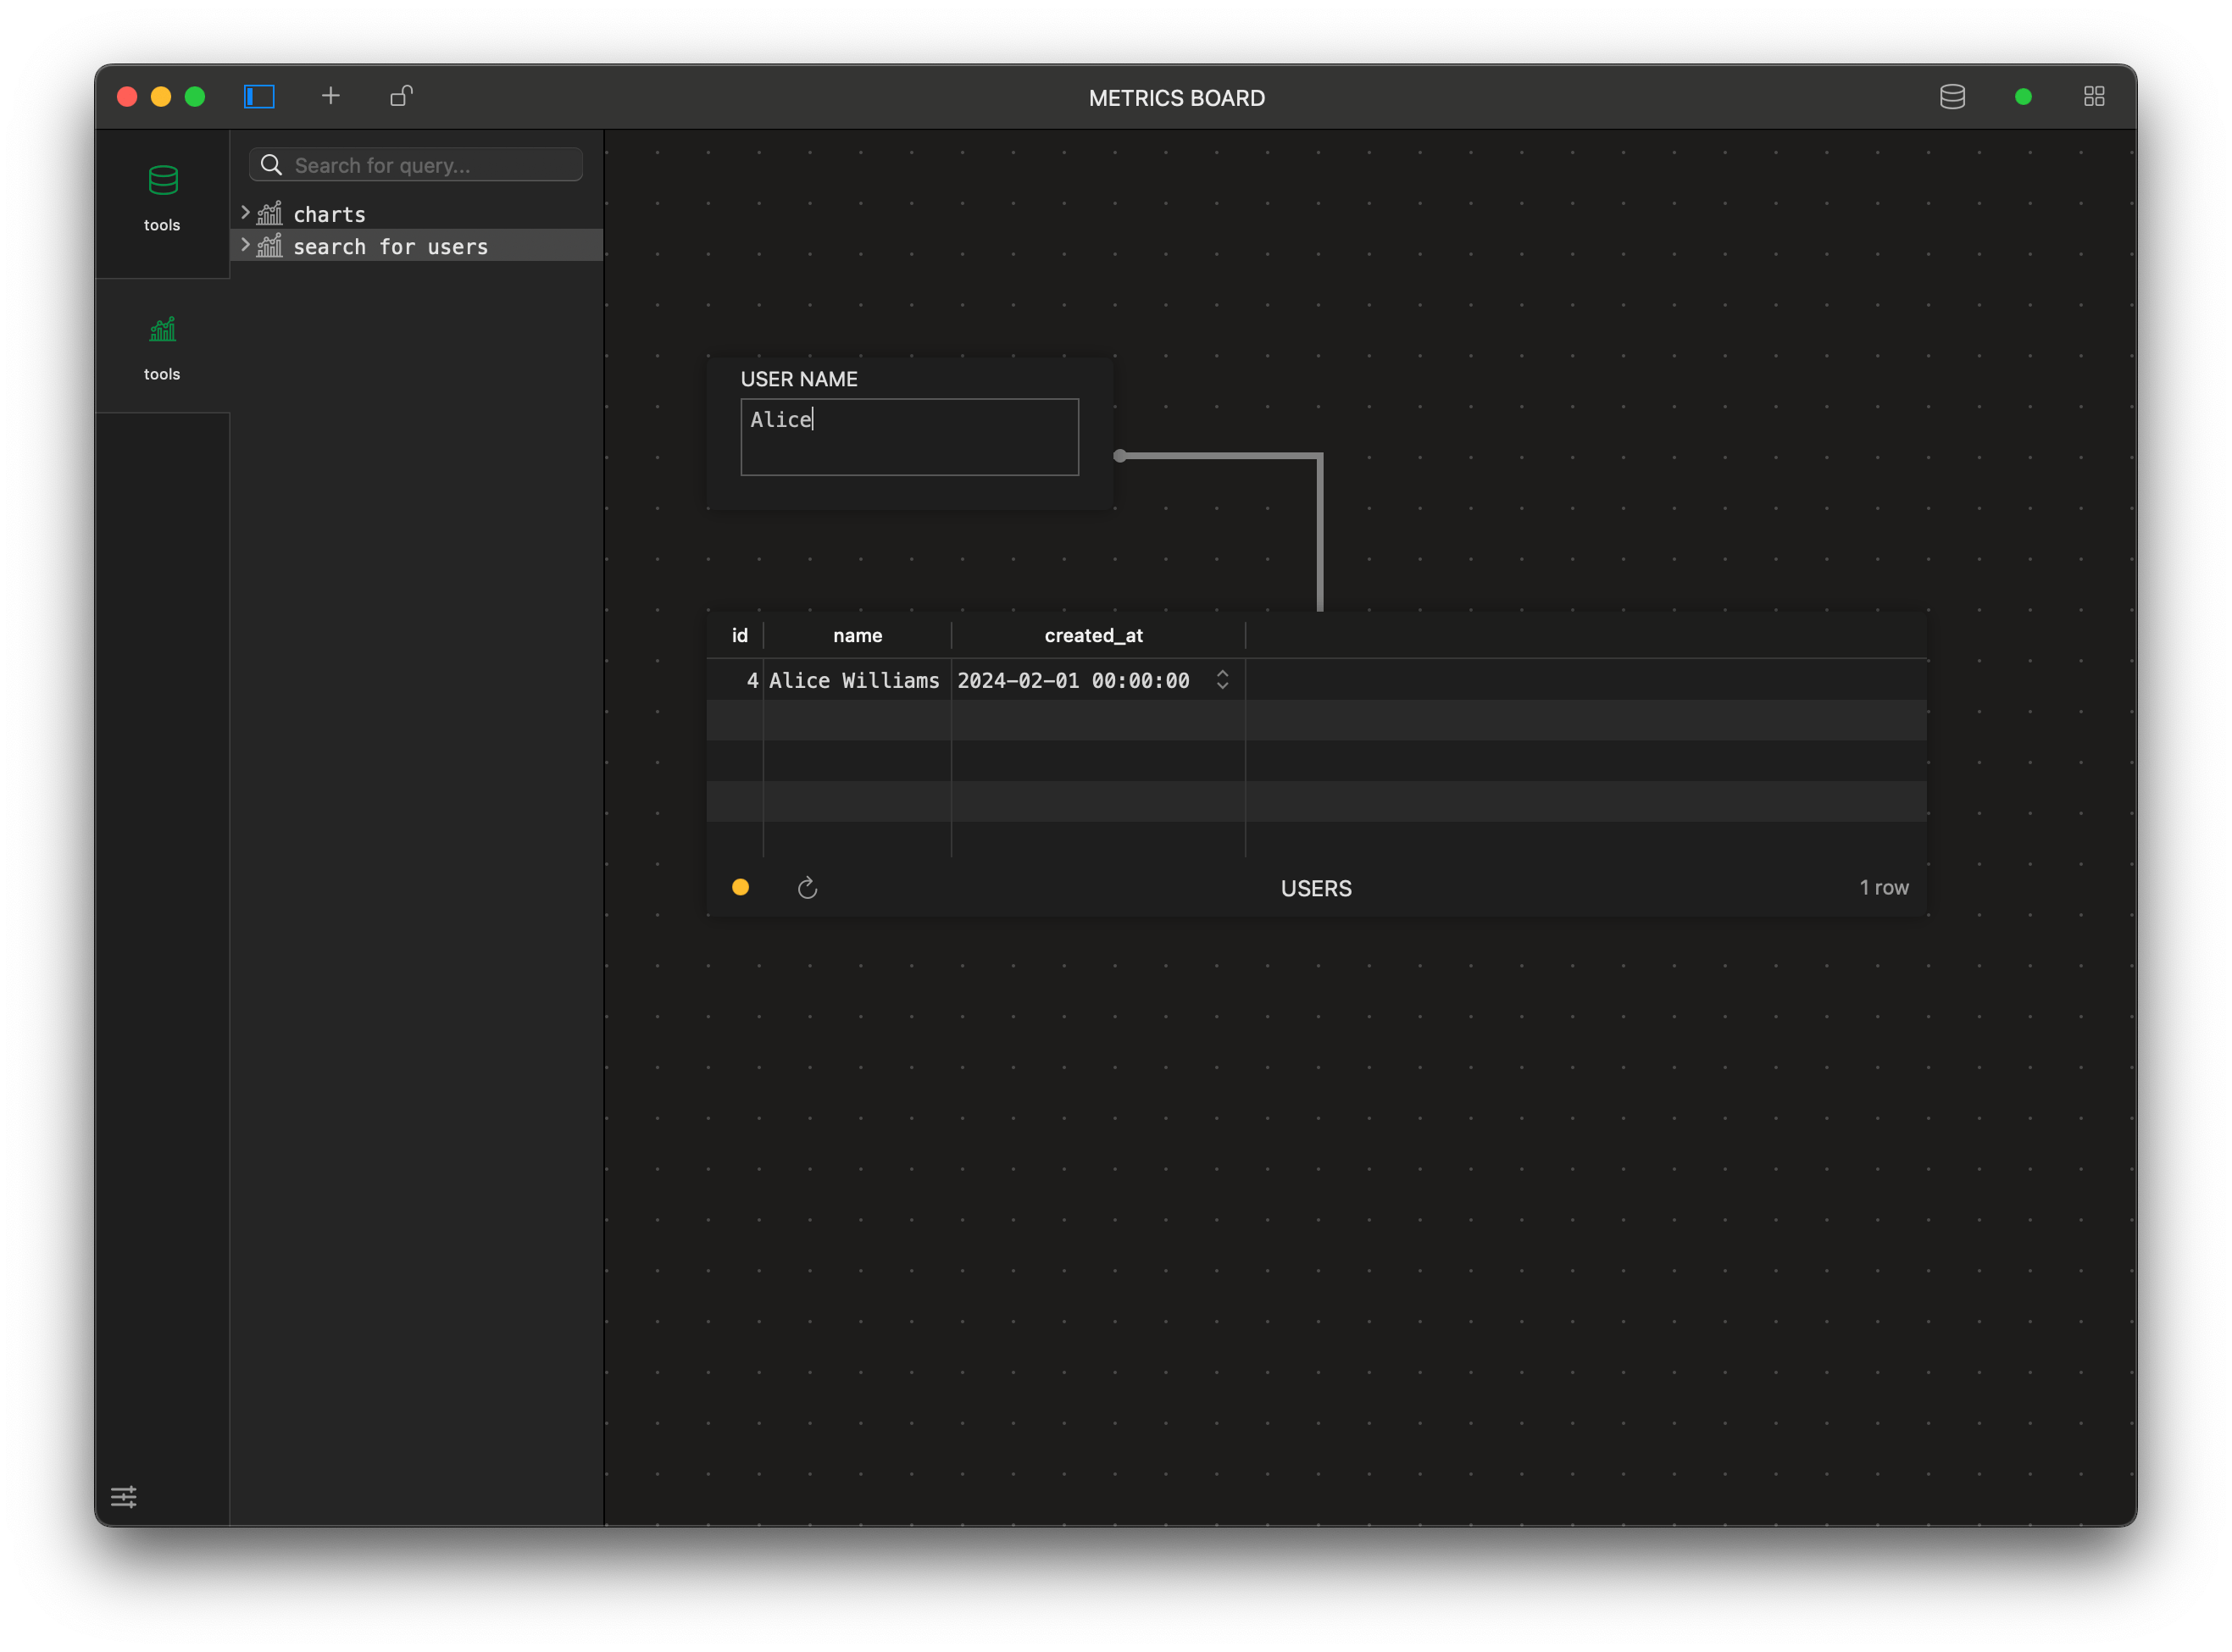
Let’s try it.
-
You can add more widgets and connect the input to them. By doing it this way, you can create many mini-tools that suit your daily workflows.
-
For example, you can find the user and the products they bought. The query used on the product table is:
SELECT products.* FROM orders JOIN products ON products.id = orders.product_id JOIN users ON users.id = orders.user_id WHERE users.name LIKE '%$name%';
